The following is a discussion of the state of the Memory Allocation Tracker feature and where it's working well and the downfalls of the current implementation as well as optimizations that can be made.
Overview
The Memory Allocation Tracker is a tool that I came up with to help reduce unnecessary allocations in an effort to improve performance and memory usage as well as detect memory leaks. From what I built, I think it does a pretty good job solving the essence of the problem. There are two parts to the Memory Allocation Tracker. A passive part, which is the tracking of allocated pointers, their origins, and allocations sizes by overriding the new and delete operators as well as some library’s allocators like GLFW’s. The other part is a more active part that involves recording all allocations and frees, their origins and stats, and a stack trace of where it was allocated/freed between two points of time. The UI allows for allocation statistics at a glance to find areas where allocations are high when they shouldn’t need to be. Additionally, the Memory Allocation Tracker integrated nicely with the scope profiler to where you can click on any scope in the trace output and see how many allocations happened in that scope. I am happy with the base of the feature, but I think there is more work to be able to leave this feature on without a big impact to the performance during development, particularly with the second more active part.
Problem and Potential Solutions
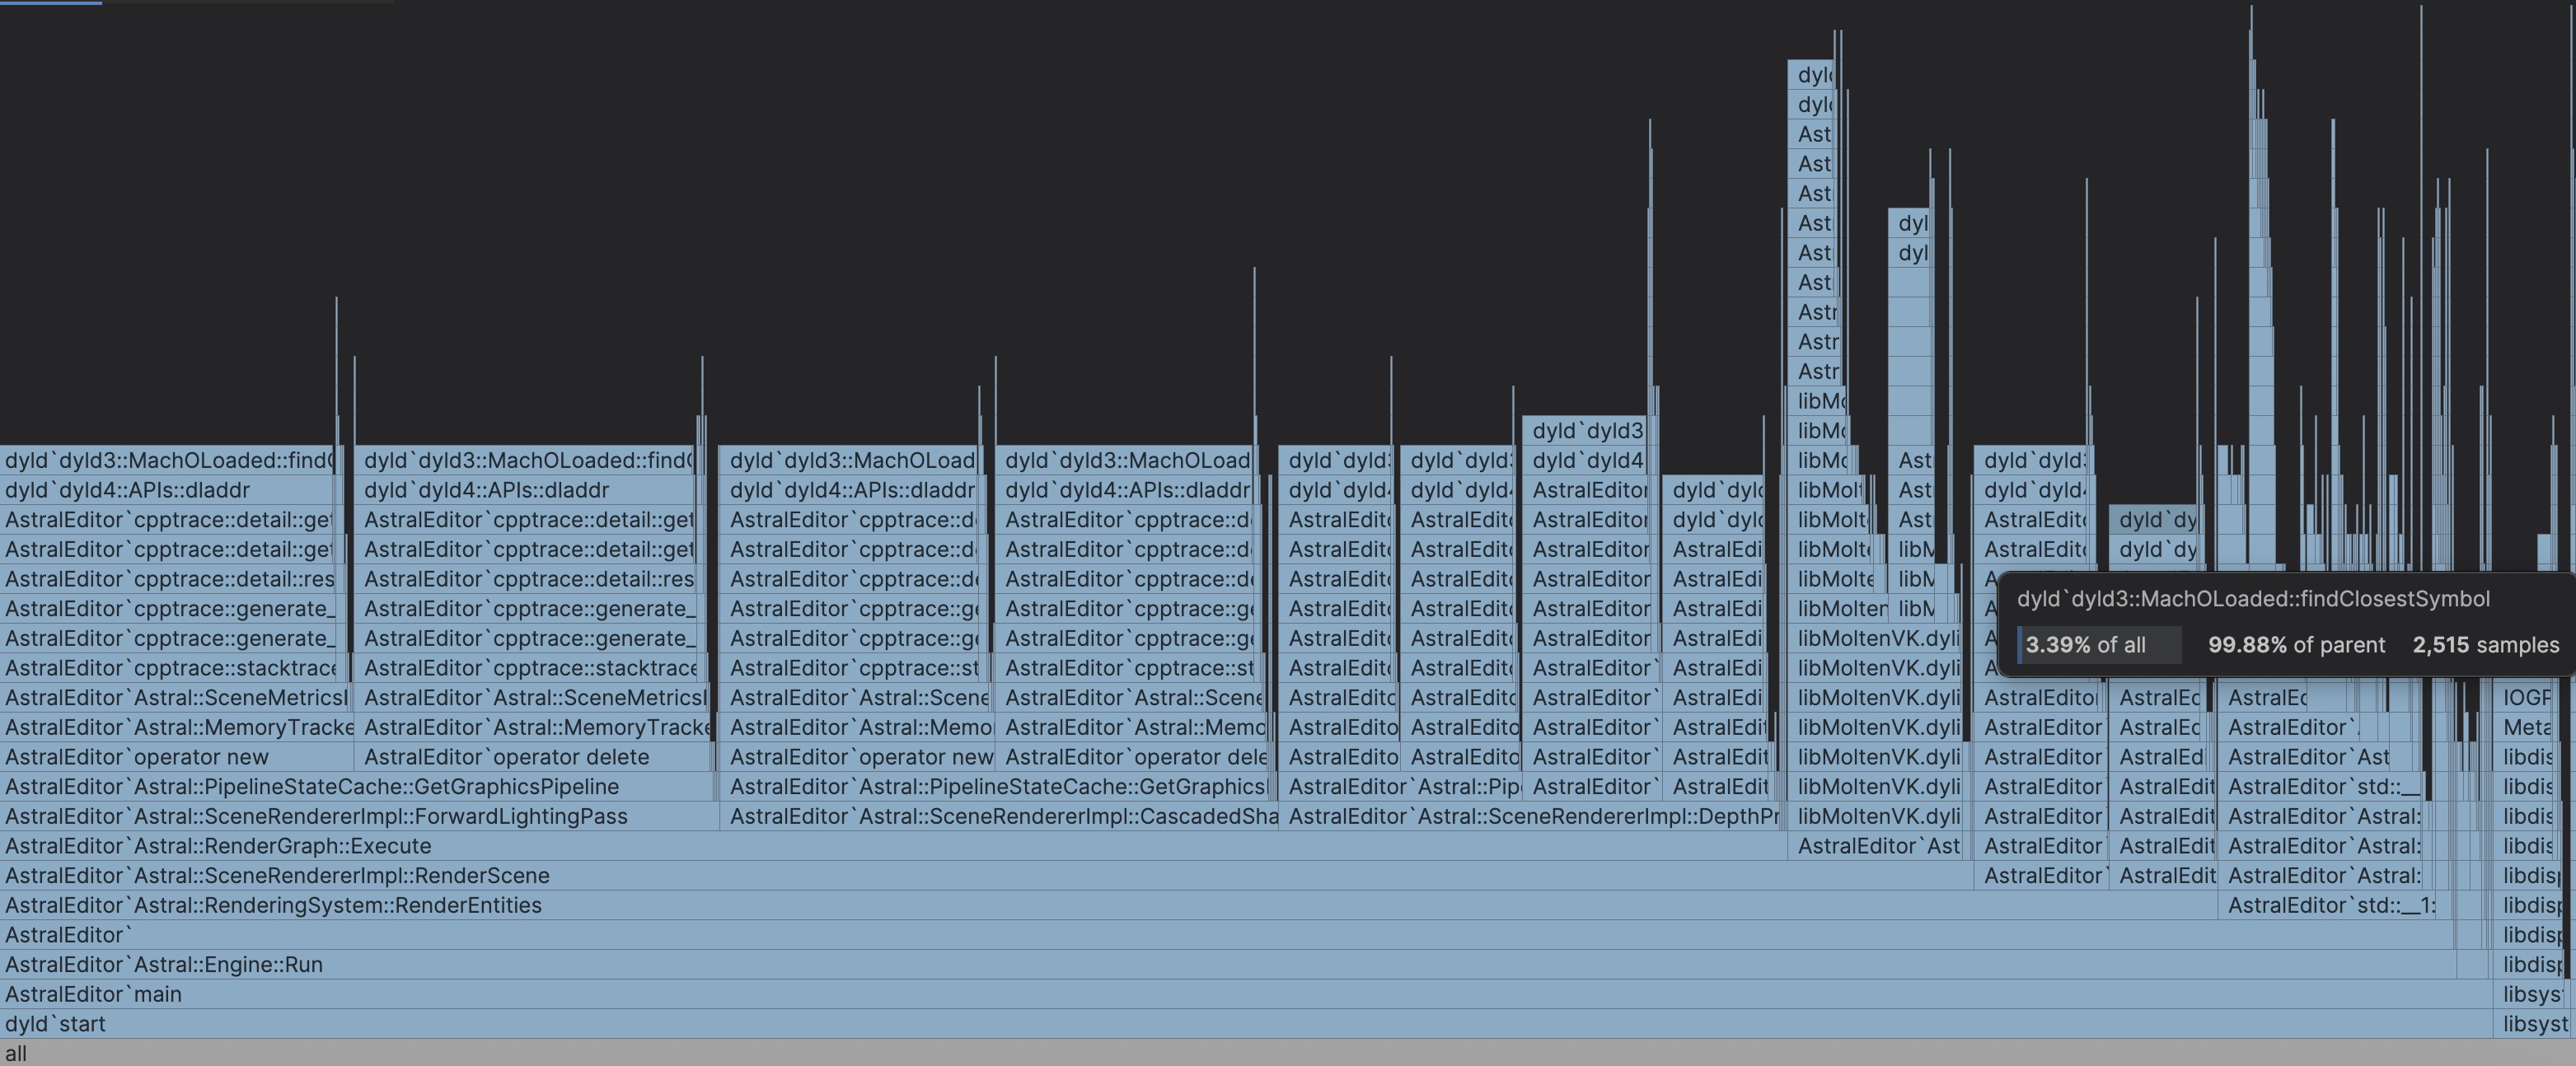
The big issue currently with the allocation recording is performance. Recording the allocations/frees and their metadata to a file at runtime or engine start up causes the FPS to fall off completely and come in and out of responsiveness. However, the performance issue is easy to see and I have many thoughts at how to optimize this. The big problem causing the issues is the stack trace symbol resolution, which is very evident in any profile of the recording process. In one profiling of the session recording for instance, symbol resolution consumed 95,267 samples out of the entire 113,062 samples in the trace. In the screenshot of the Flame Graph below, you can see clearly that we are spending basically the whole time of the trace doing symbol resolution for allocation/free stack traces. My first immediate solution to this is to defer symbol resolution till after the recording session is done. This will reduce the overhead experienced during the actual recording, which will make the allocation recording much more bearable and useable. I will accomplish this by saving the raw stack traces instead of immediately resolving the stack trace and saving the result. Using raw stack traces is much cheaper as its just memory addresses compared to the resolution process of stack traces and then saving a string version. By implementing this solution, it will reduce the overhead of the memory allocation recording significantly.
Multithreaded Symbol Resolution
While the first solution will reduce overhead during recording, it creates another issue. The raw stack traces will still need to be resolved to be viewable in the UI. I essentially moved the work all from during the recording to after the recording. By moving the work till after recording, I reduce overhead but it leaves me with a big long hang while the processing of every stack trace occurs when the recording ends, which could be a very high amount as allocations and frees happen frequently. The fix I have came up for this issue would be to move the stack trace resolution work to a separate thread or threads. Moving the work to at least one thread would remove the editor hang that would have been experienced. If I moved the work to two or more threads, I could process multiple stack traces concurrently which would result in a much shorter wait time. And conveniently, I recently implemented a thread pool which I could use to pass the work to the threads and use a std::future to check if the work is done or not. In a separate thought, if I constrain the viewing of the session recording to lifetime of my program, I can lazily resolve the symbols of stack traces only when the user tries to view a specific allocation/free. And then I only need to perform the resolving for all stack traces if the user explicitly saves the session to disk.
Other Potential Optimizations
To sum up, the solution to Memory Allocation Tracker session capture performance consists of deferring symbol resolution till the end of the recording session and batching the symbol resolution work onto multiple other threads to process the symbols concurrently for the fastest performance during and after a recording session. But why stop there? My priority is to reduce overhead during the recording as much as possible, and another overhead cost is IO work. During the recording process, I write the state of the Memory Tracker statistics as well as the allocation/free stack trace to a file, so that it can be viewed later in the UI. This naturally can cause some overhead as I have to write to disk. One solution to this would involve building up the write contents into a big buffer and only when the buffer gets filled to a sufficient size do I write that buffer's contents into the file on a separate thread to remove the overhead of IO on the main thread where I handle the recording.
Optimizing Passive Allocation Tracking and Thread Locking
On the topic of optimizations, I am considering a look into spin locks and any applicable lock-free data structures that I could use in the passive part of tracking of memory allocation sizes. Allocations and frees happen on any of the threads, so naturally, the Memory Tracker is thread safe. However, mutexes in the memory tracker might cause overhead because I use the same lock from any read or writes to the memory tracking stats which happen frequently with the amount of allocations each thread does. Furthermore, hopefully after the earlier optimizations, the cost of acquiring the mutex will be more than the amount of work being done. If that is the case, then a spin lock would be more suitable to avoid slower OS calls. Using spin locks in that case would lower overhead in passive tracking of memory allocations.
Conclusion
Currently, I have not started on any optimization work in the Memory Allocation Tracker, however this is the plan when it does happen. I don't think it will be soon. I have many features, enhancements, and optimizations I want to get to all across the engine and the performance issue for the recording sessions is bearable for me as I can hardcode recording sessions in the code. If there were a team of people using the tool, then I would fix this right away as it would let people work faster. However, it is just for me now and it is bearable for me when considering the amount of time needed to improve it further. In other words, the outlined optimizations is not worth the effort compared to the reward I get from it, therefore, optimization work for the Memory Allocation Tracker is on the back burner for now.